
Client: Gordian (RSMeans Data Online)
Timeline: January–October 2020
Role: Lead UX Designer (strategy, research, interaction design, prototyping)
Team: Product managers, subject matter experts, engineering team
Tools: Figma, design system libraries, prototyping frameworks
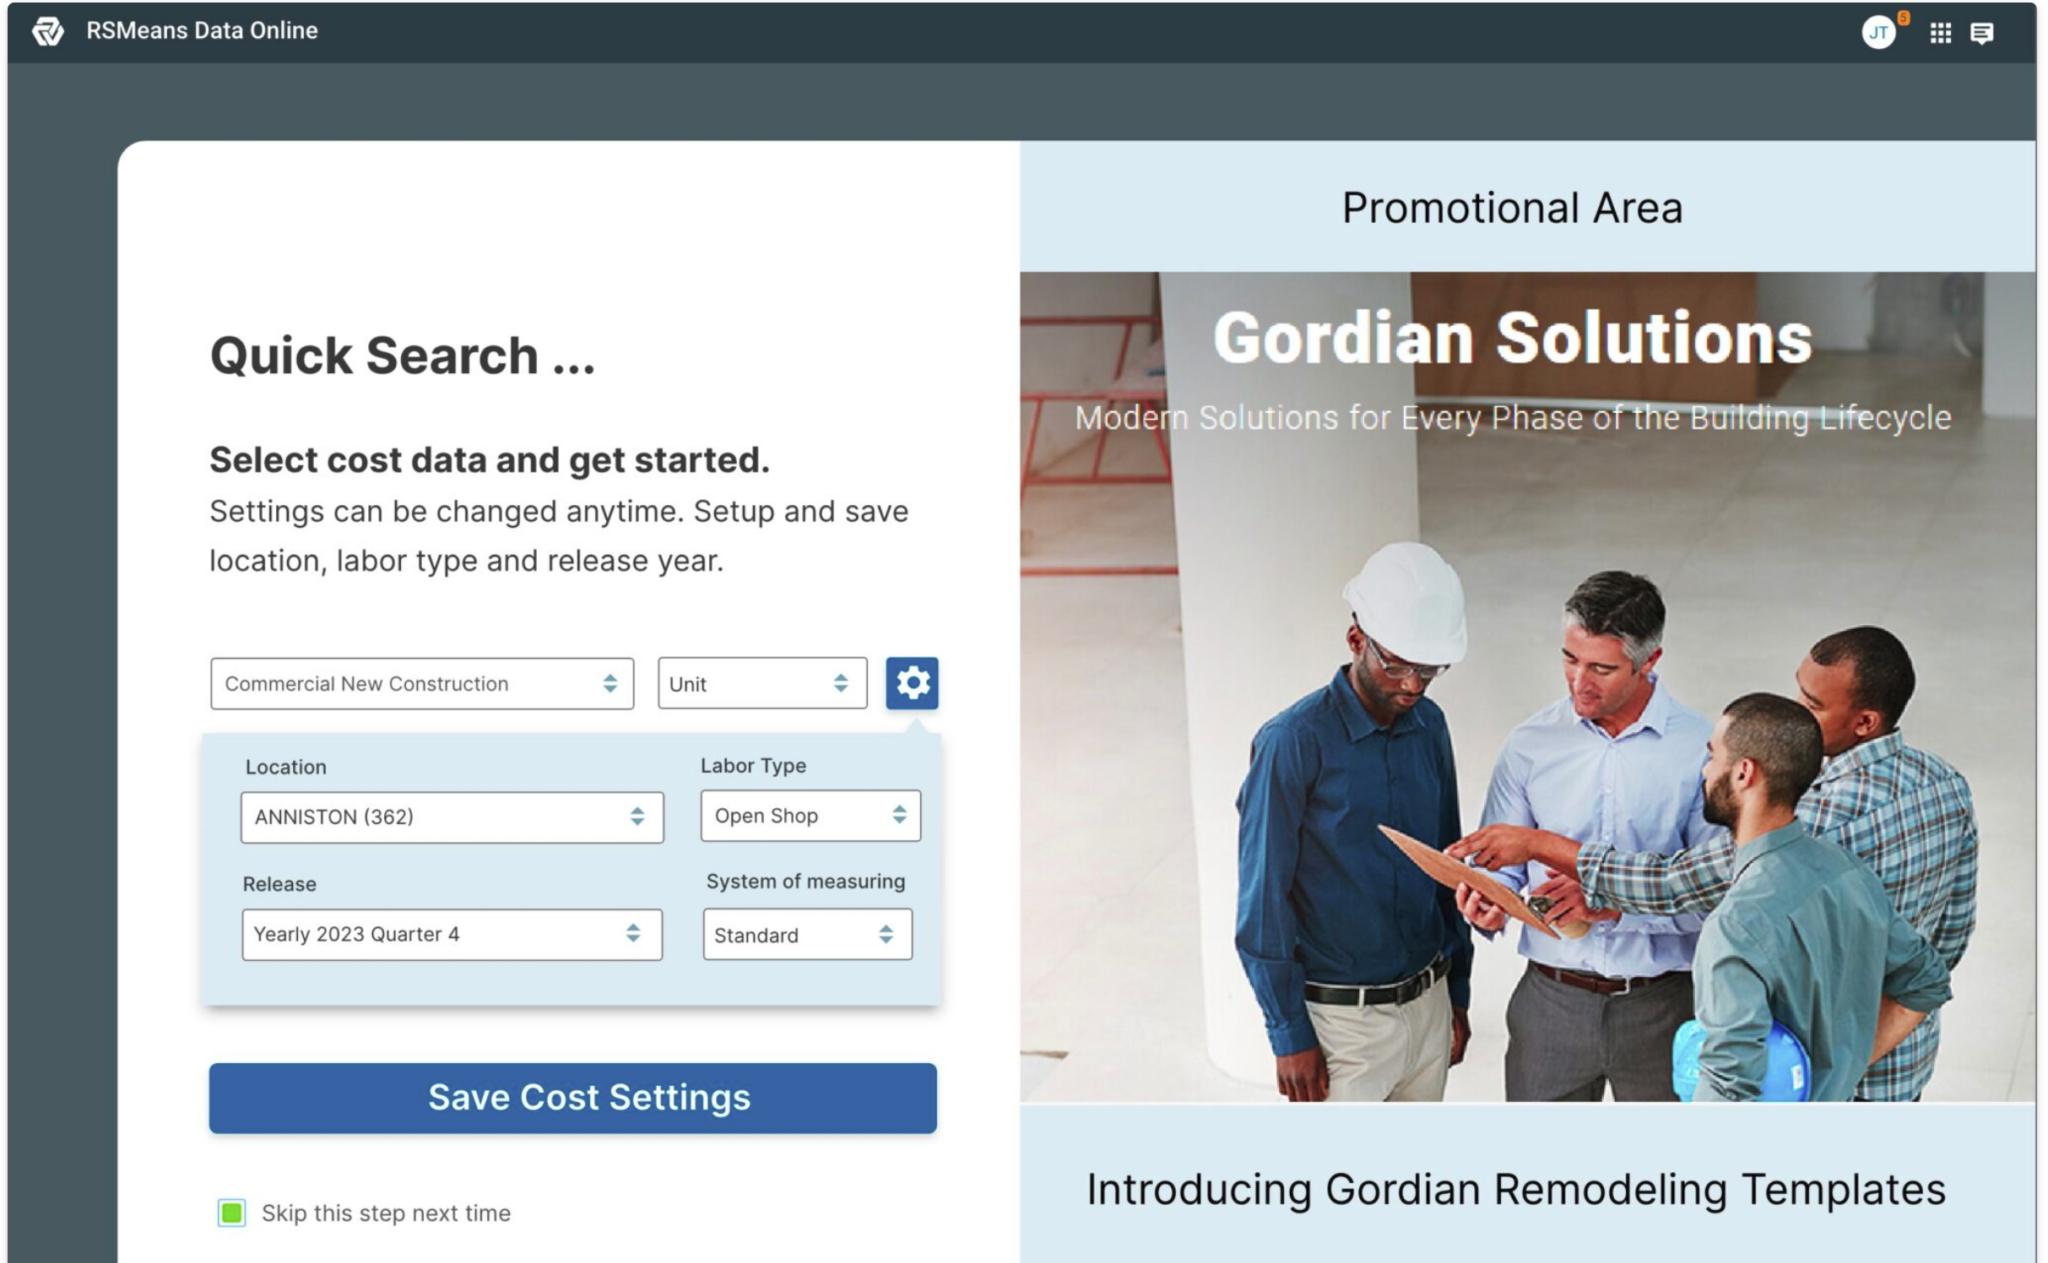
Project SummaryGordian’s RSMeans Data Online, a construction cost estimating platform, required a full overhaul of its legacy product catalog for more efficient searches and frequent context-switching between the catalog and the estimate builder. Stakeholders, long accustomed to the familiar but clunky interface, were initially skeptical of change. Buy-in required research-backed evidence and a clear demonstration of business value. Scalable interaction patterns Beyond immediate usability gains, I established interaction patterns (floating toolbox, adaptive filters, accessibility compliance) that could scale across Gordian’s enterprise suite. While I wasn’t embedded long enough to formalize a full design system, the artifacts and research I delivered acted as a blueprint for product and engineering to expand, aligning the product roadmap with commercialization goals and setting a precedent for evidence-driven design at scale.
|
Business OutcomesEfficiency Gains (Time & Accuracy user-testing outcomes)
Scalability & Enterprise Readiness
|
| (click images to enlarge)
|
Research
|
Solution – Preparing for commercializationI worked with the product team defining GTM (go-to-market) details with packages. How would the service design and the product link up for best outcomes. This is important early in the ideation process. I can design to scale the product in the direction of a commercialization plan for a year in advance. |
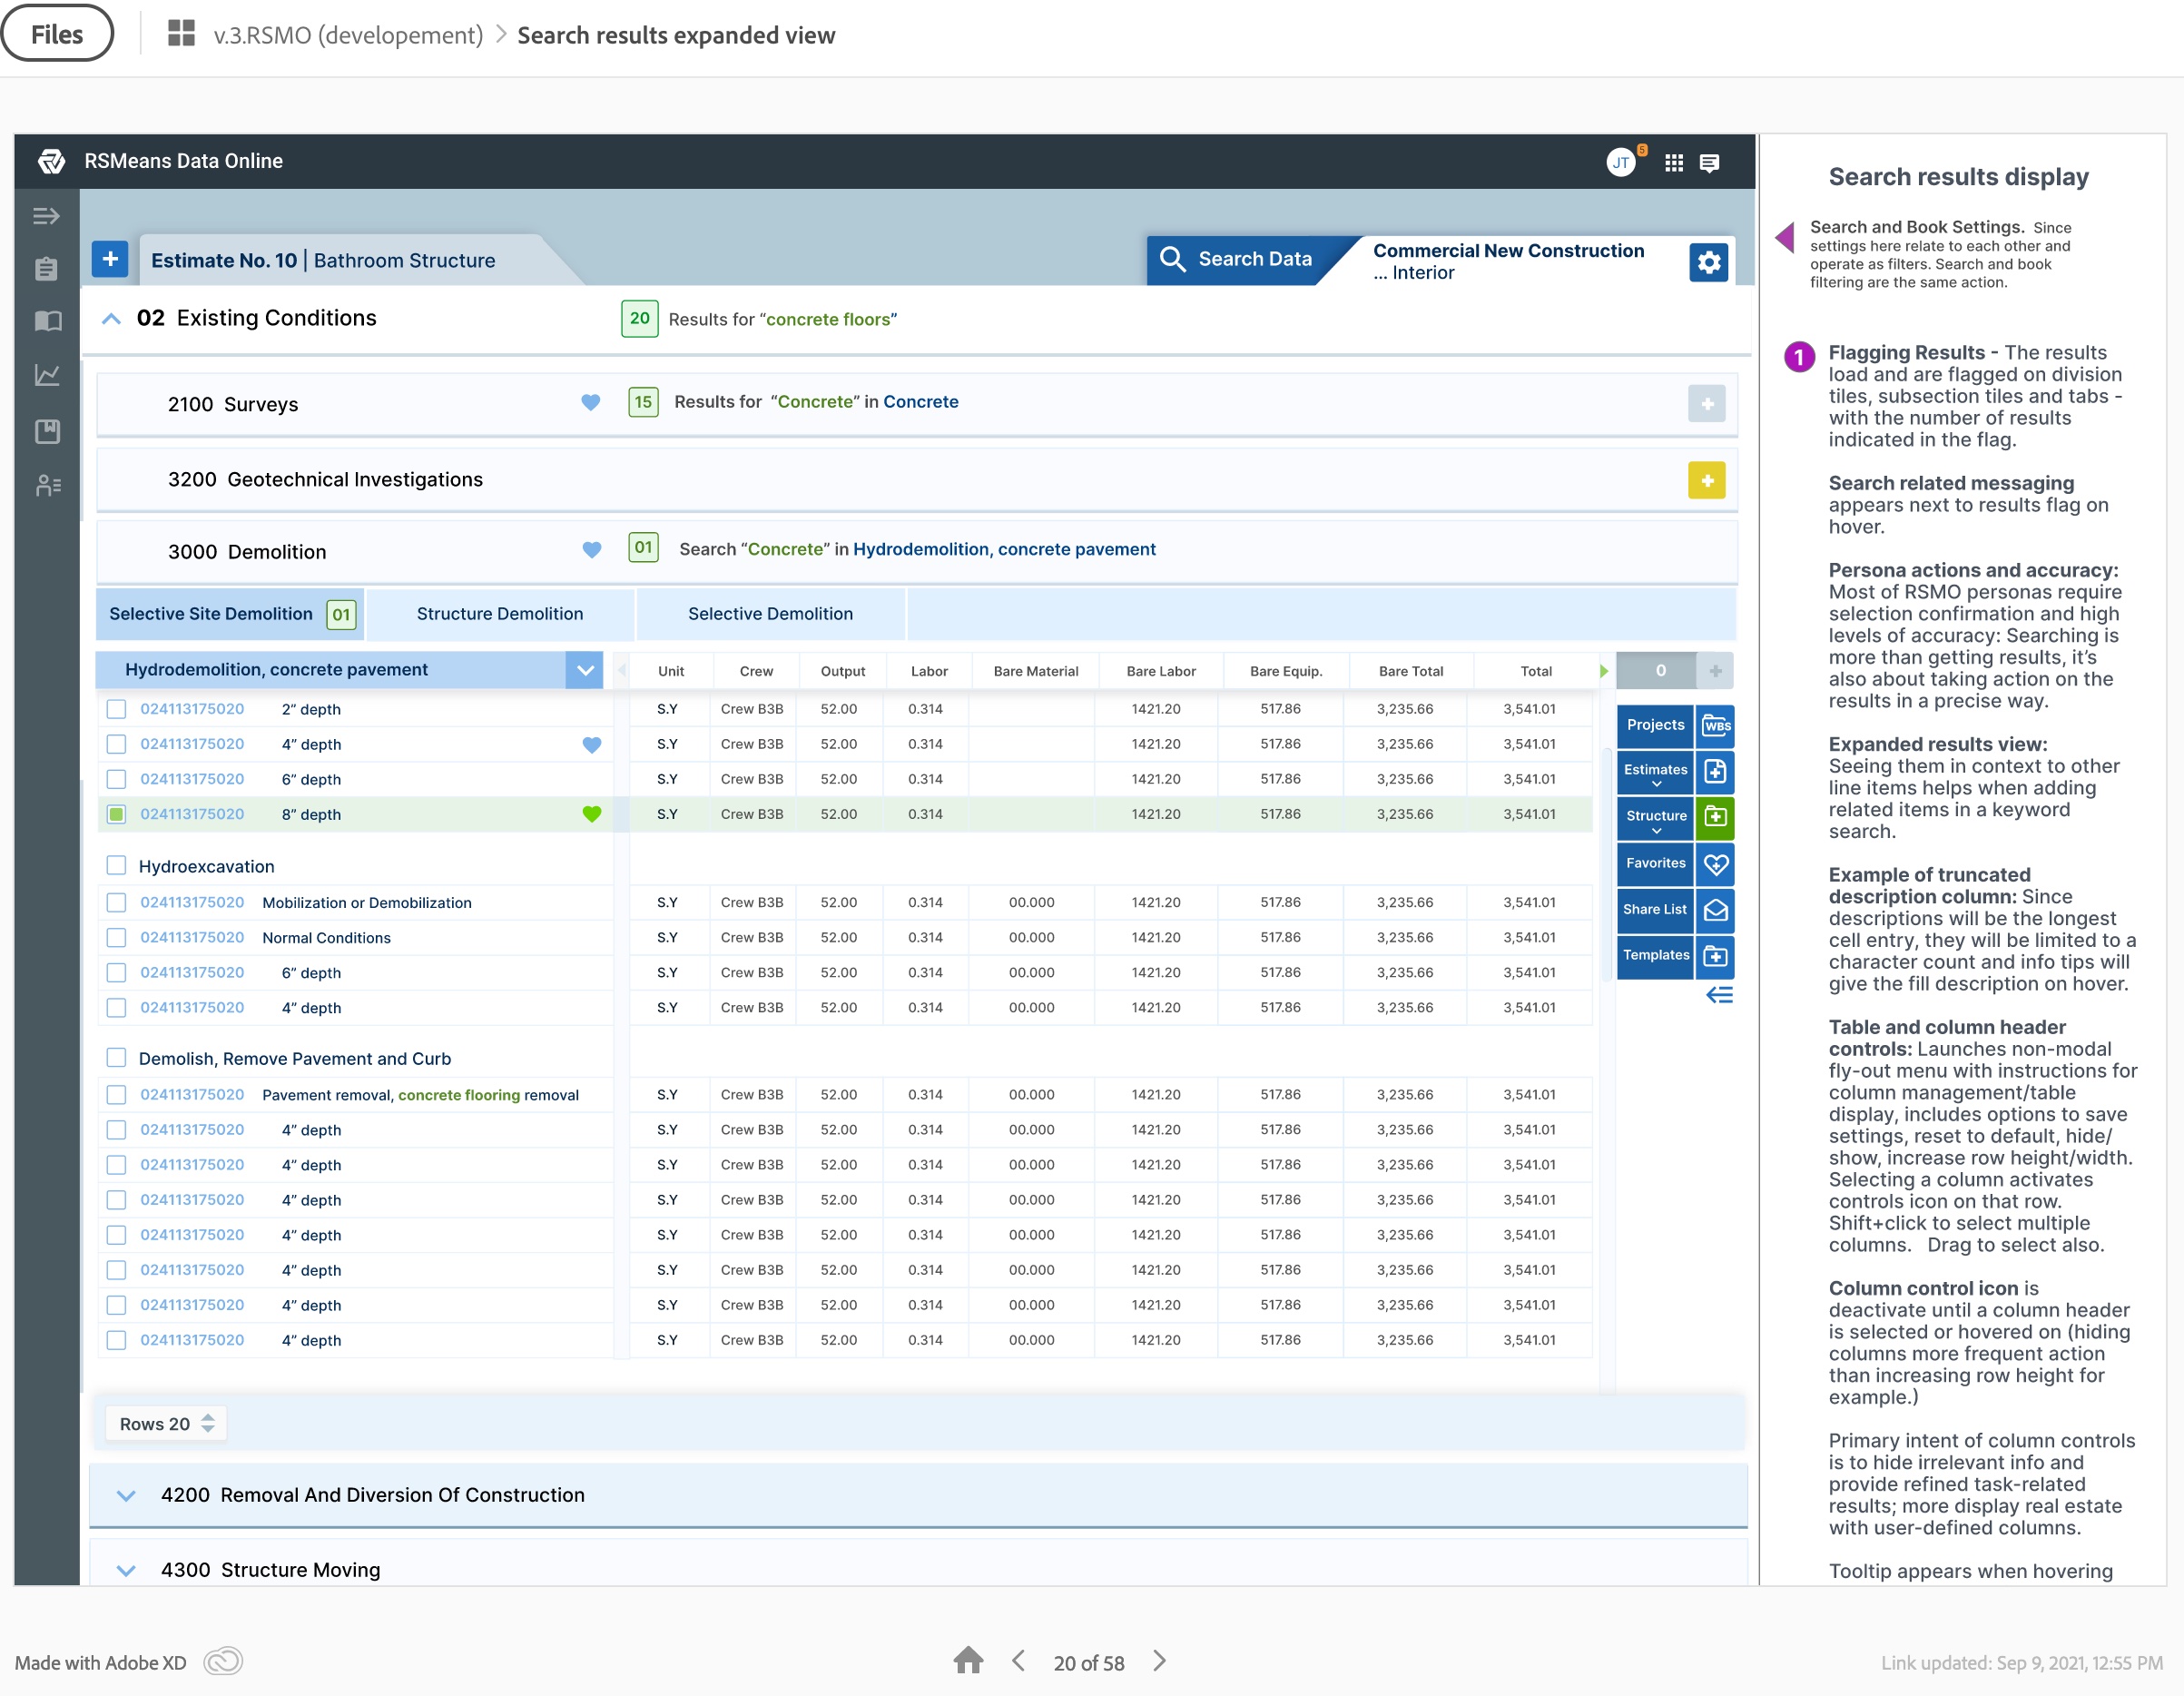
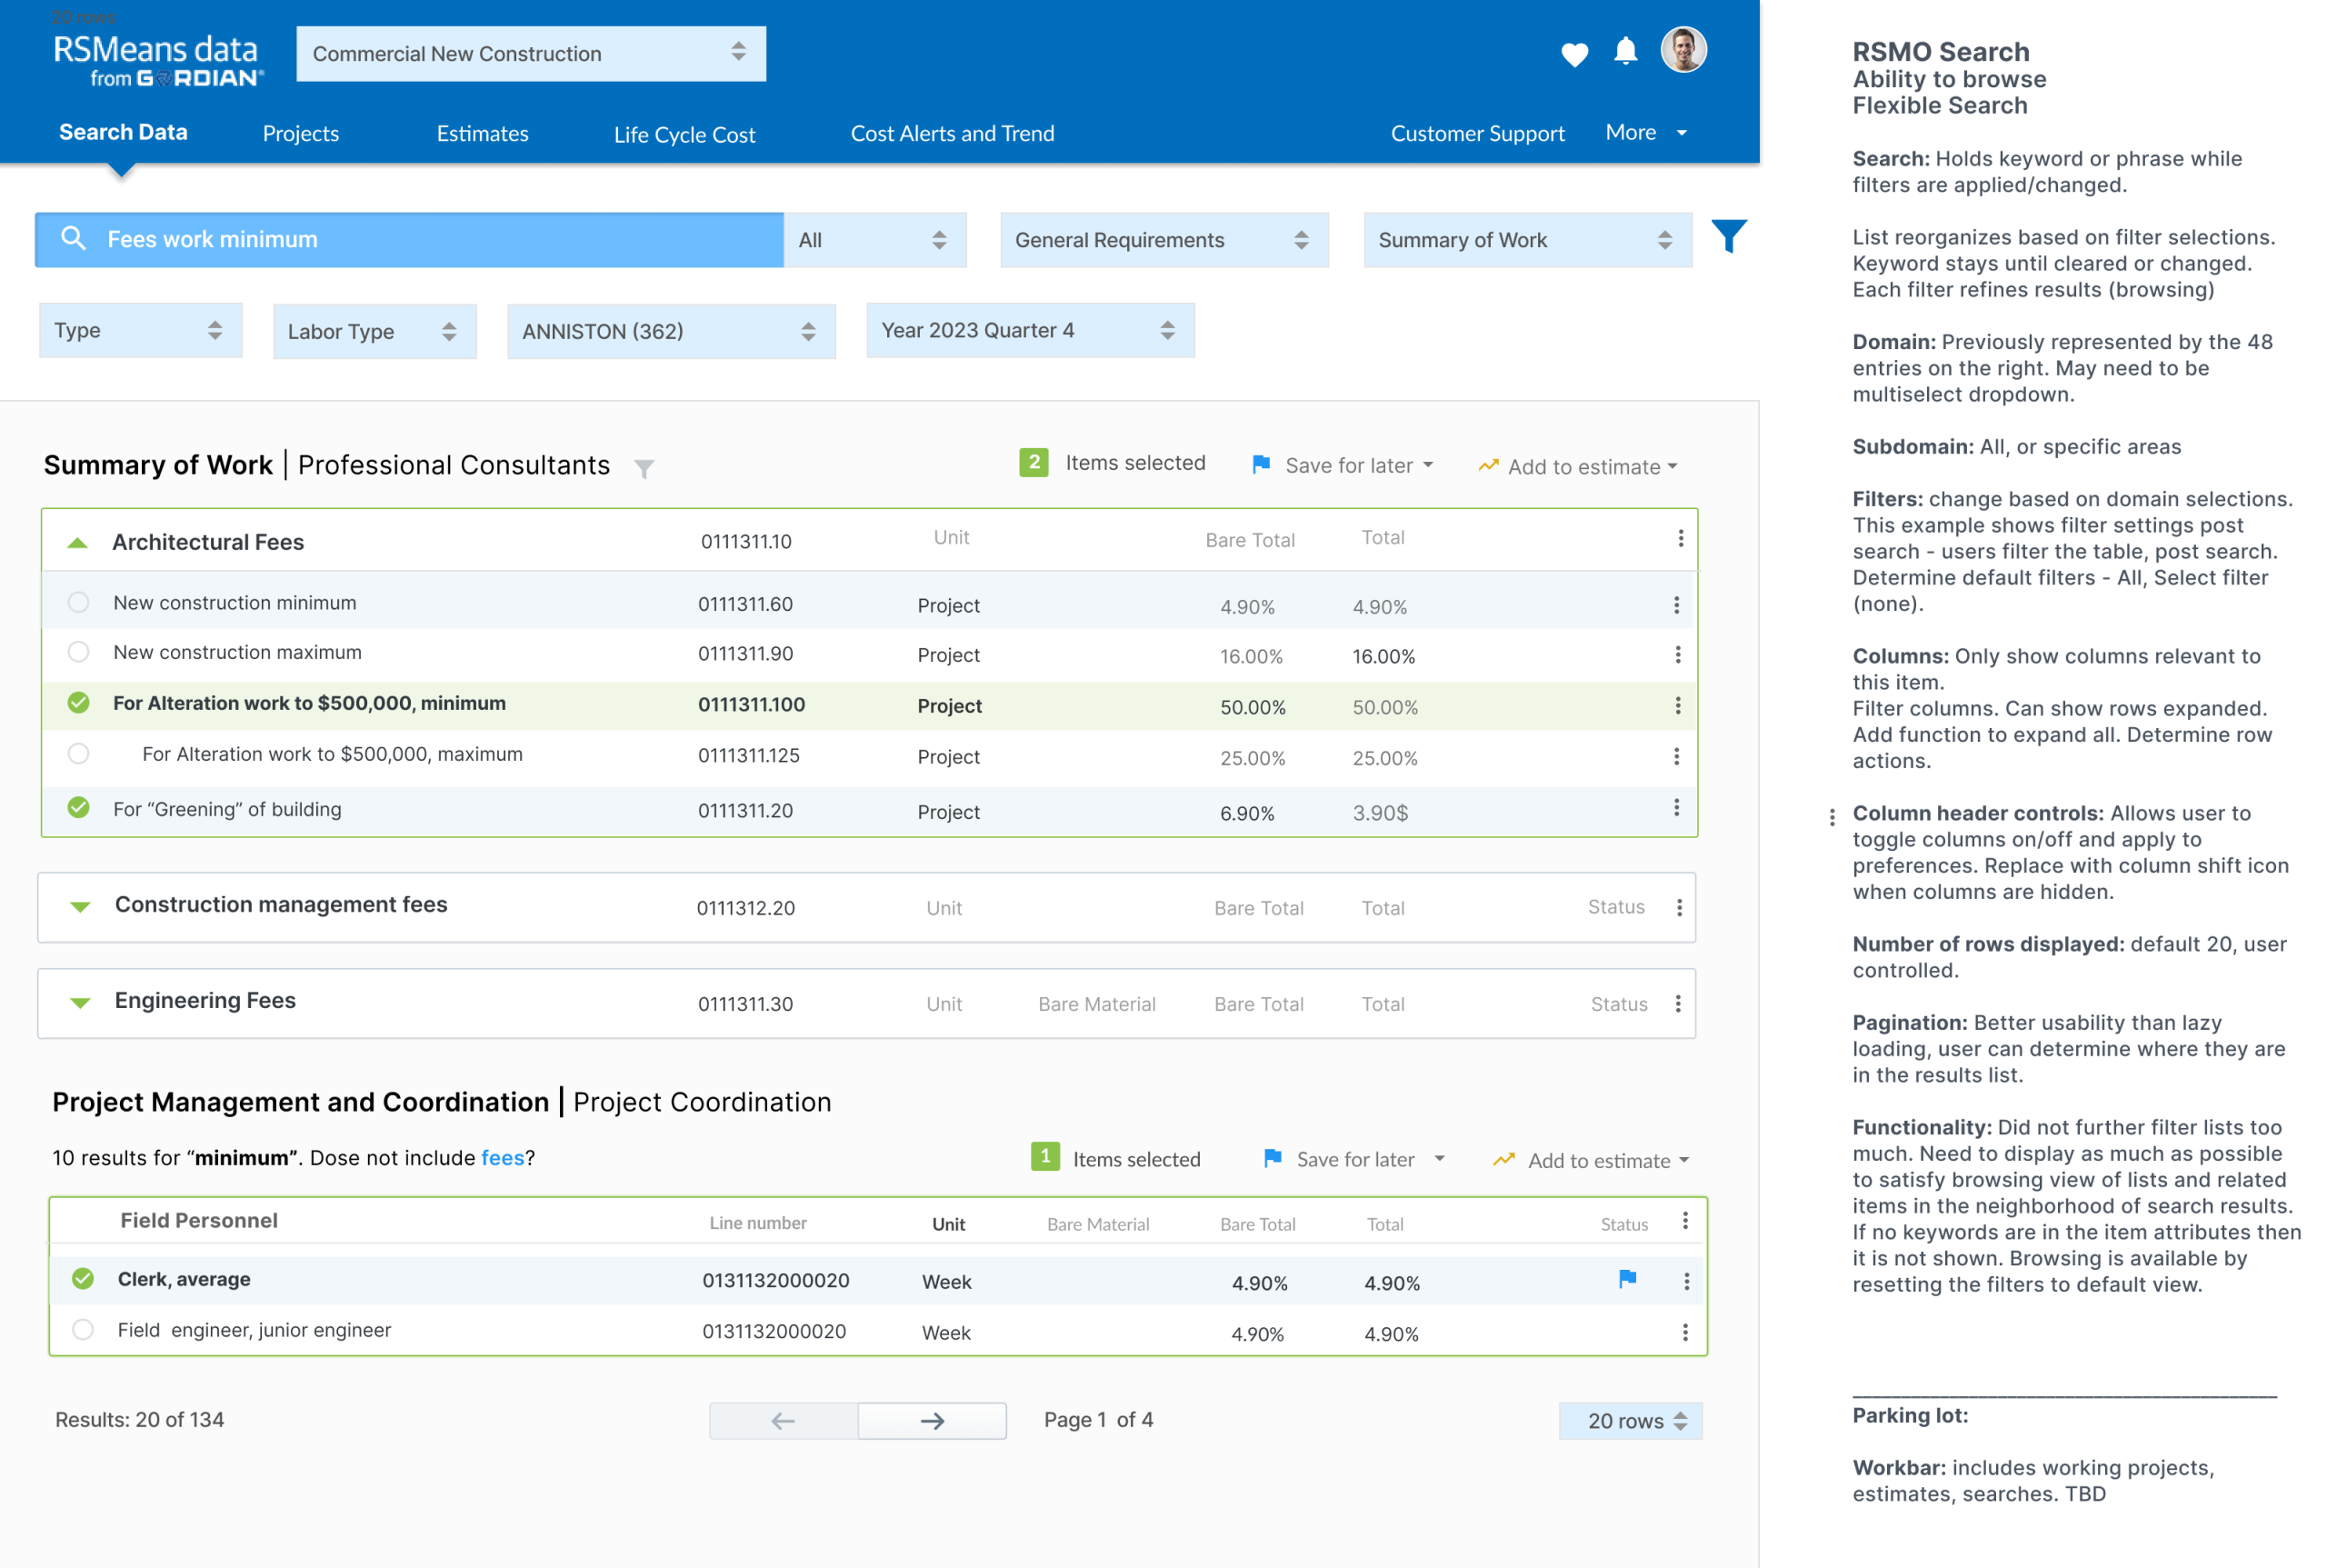
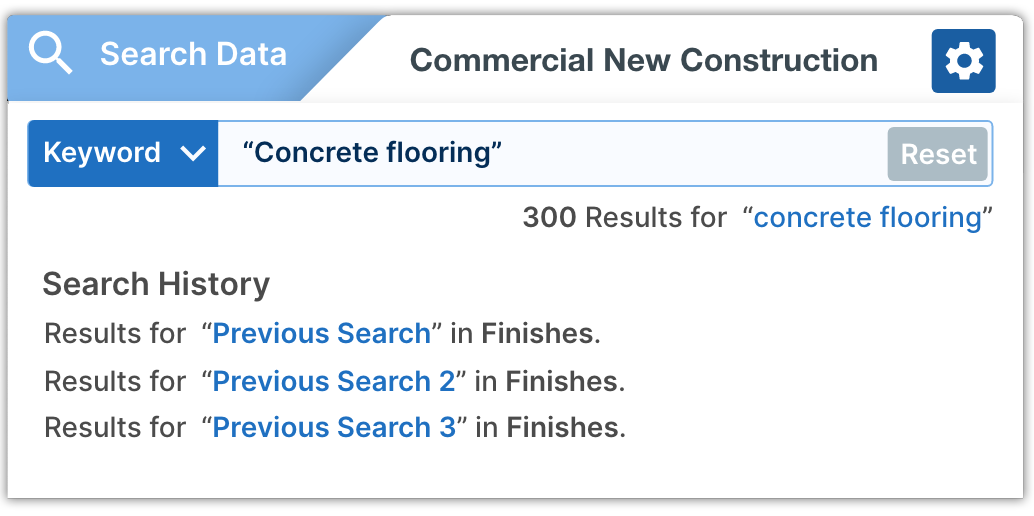
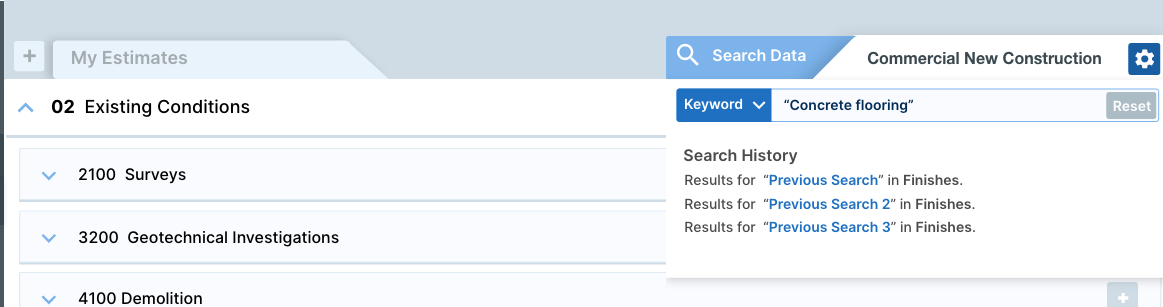
Getting to final designsWe learned that they are selecting items from the catalog to add to an estimate for a builder or architect for a construction project: nails, girders, 1000s of parts. Top right search component contains and retains all information related to the catalog. The left side tab is your estimate. You can switch back and forth as needed, each holding your spot. Then I explained the ability for the user to drag the tab to a separate window, but it’s not necessary anymore. Users will be able to tag all items without ever looking at the estimate and just tap commit. We have estimates tab handy for quick reference, which helps with recall anxiety and double confirmation that all items were added correctly. |
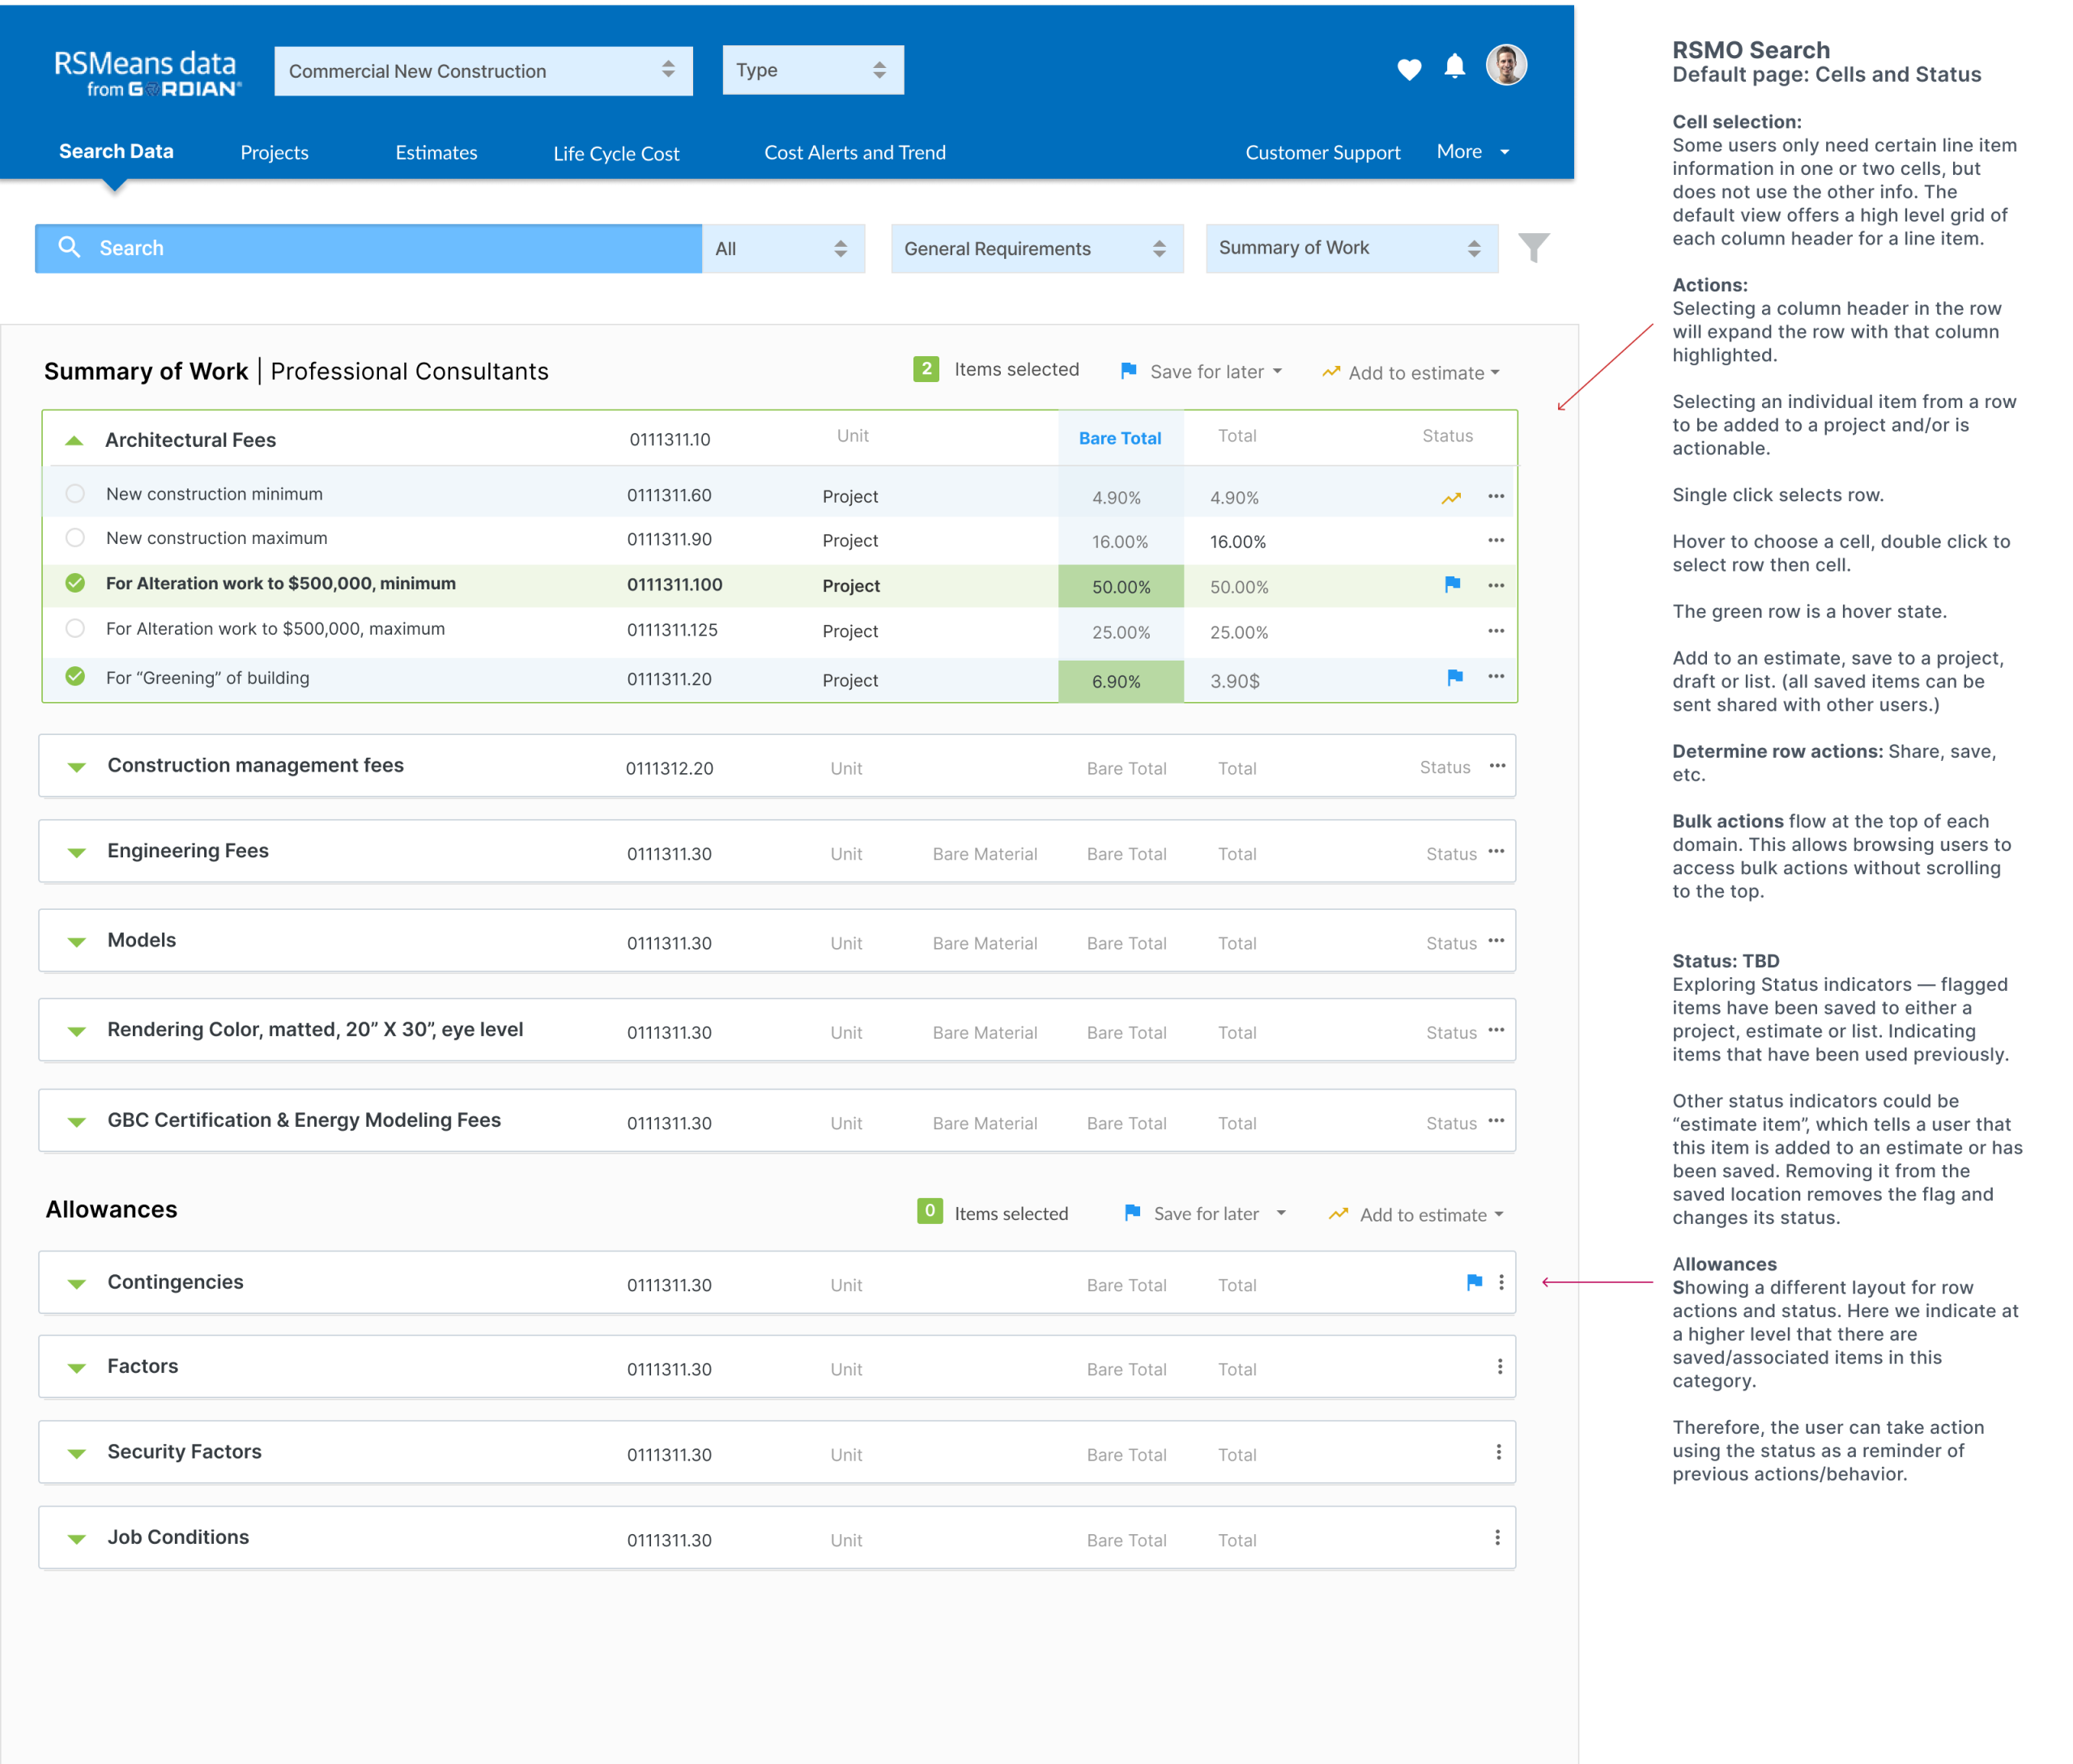
Catalog DesignThe left rail is the main catalog menu. The right rail has a floating toolbox, expanding when needed, then it tucking itself away neatly (orchestrated workflows). Certain tasks may require specific tools that trigger the expansion of the toolbox. Users will be able to easily manage multiple estimates with many sections, easily adding items from the RSMeans catalog in one window. The toolbox on the right holds the selections and allows users to add selected items to any estimate in one click. For example, multi-selecting items in the catalog will trigger the toolbox to expand. If I’m building an estimate in the open tab, even though it’s not visible, I can quickly reference the catalog from the estimate, and visa versa.
|
Final Mockups
 |
  |
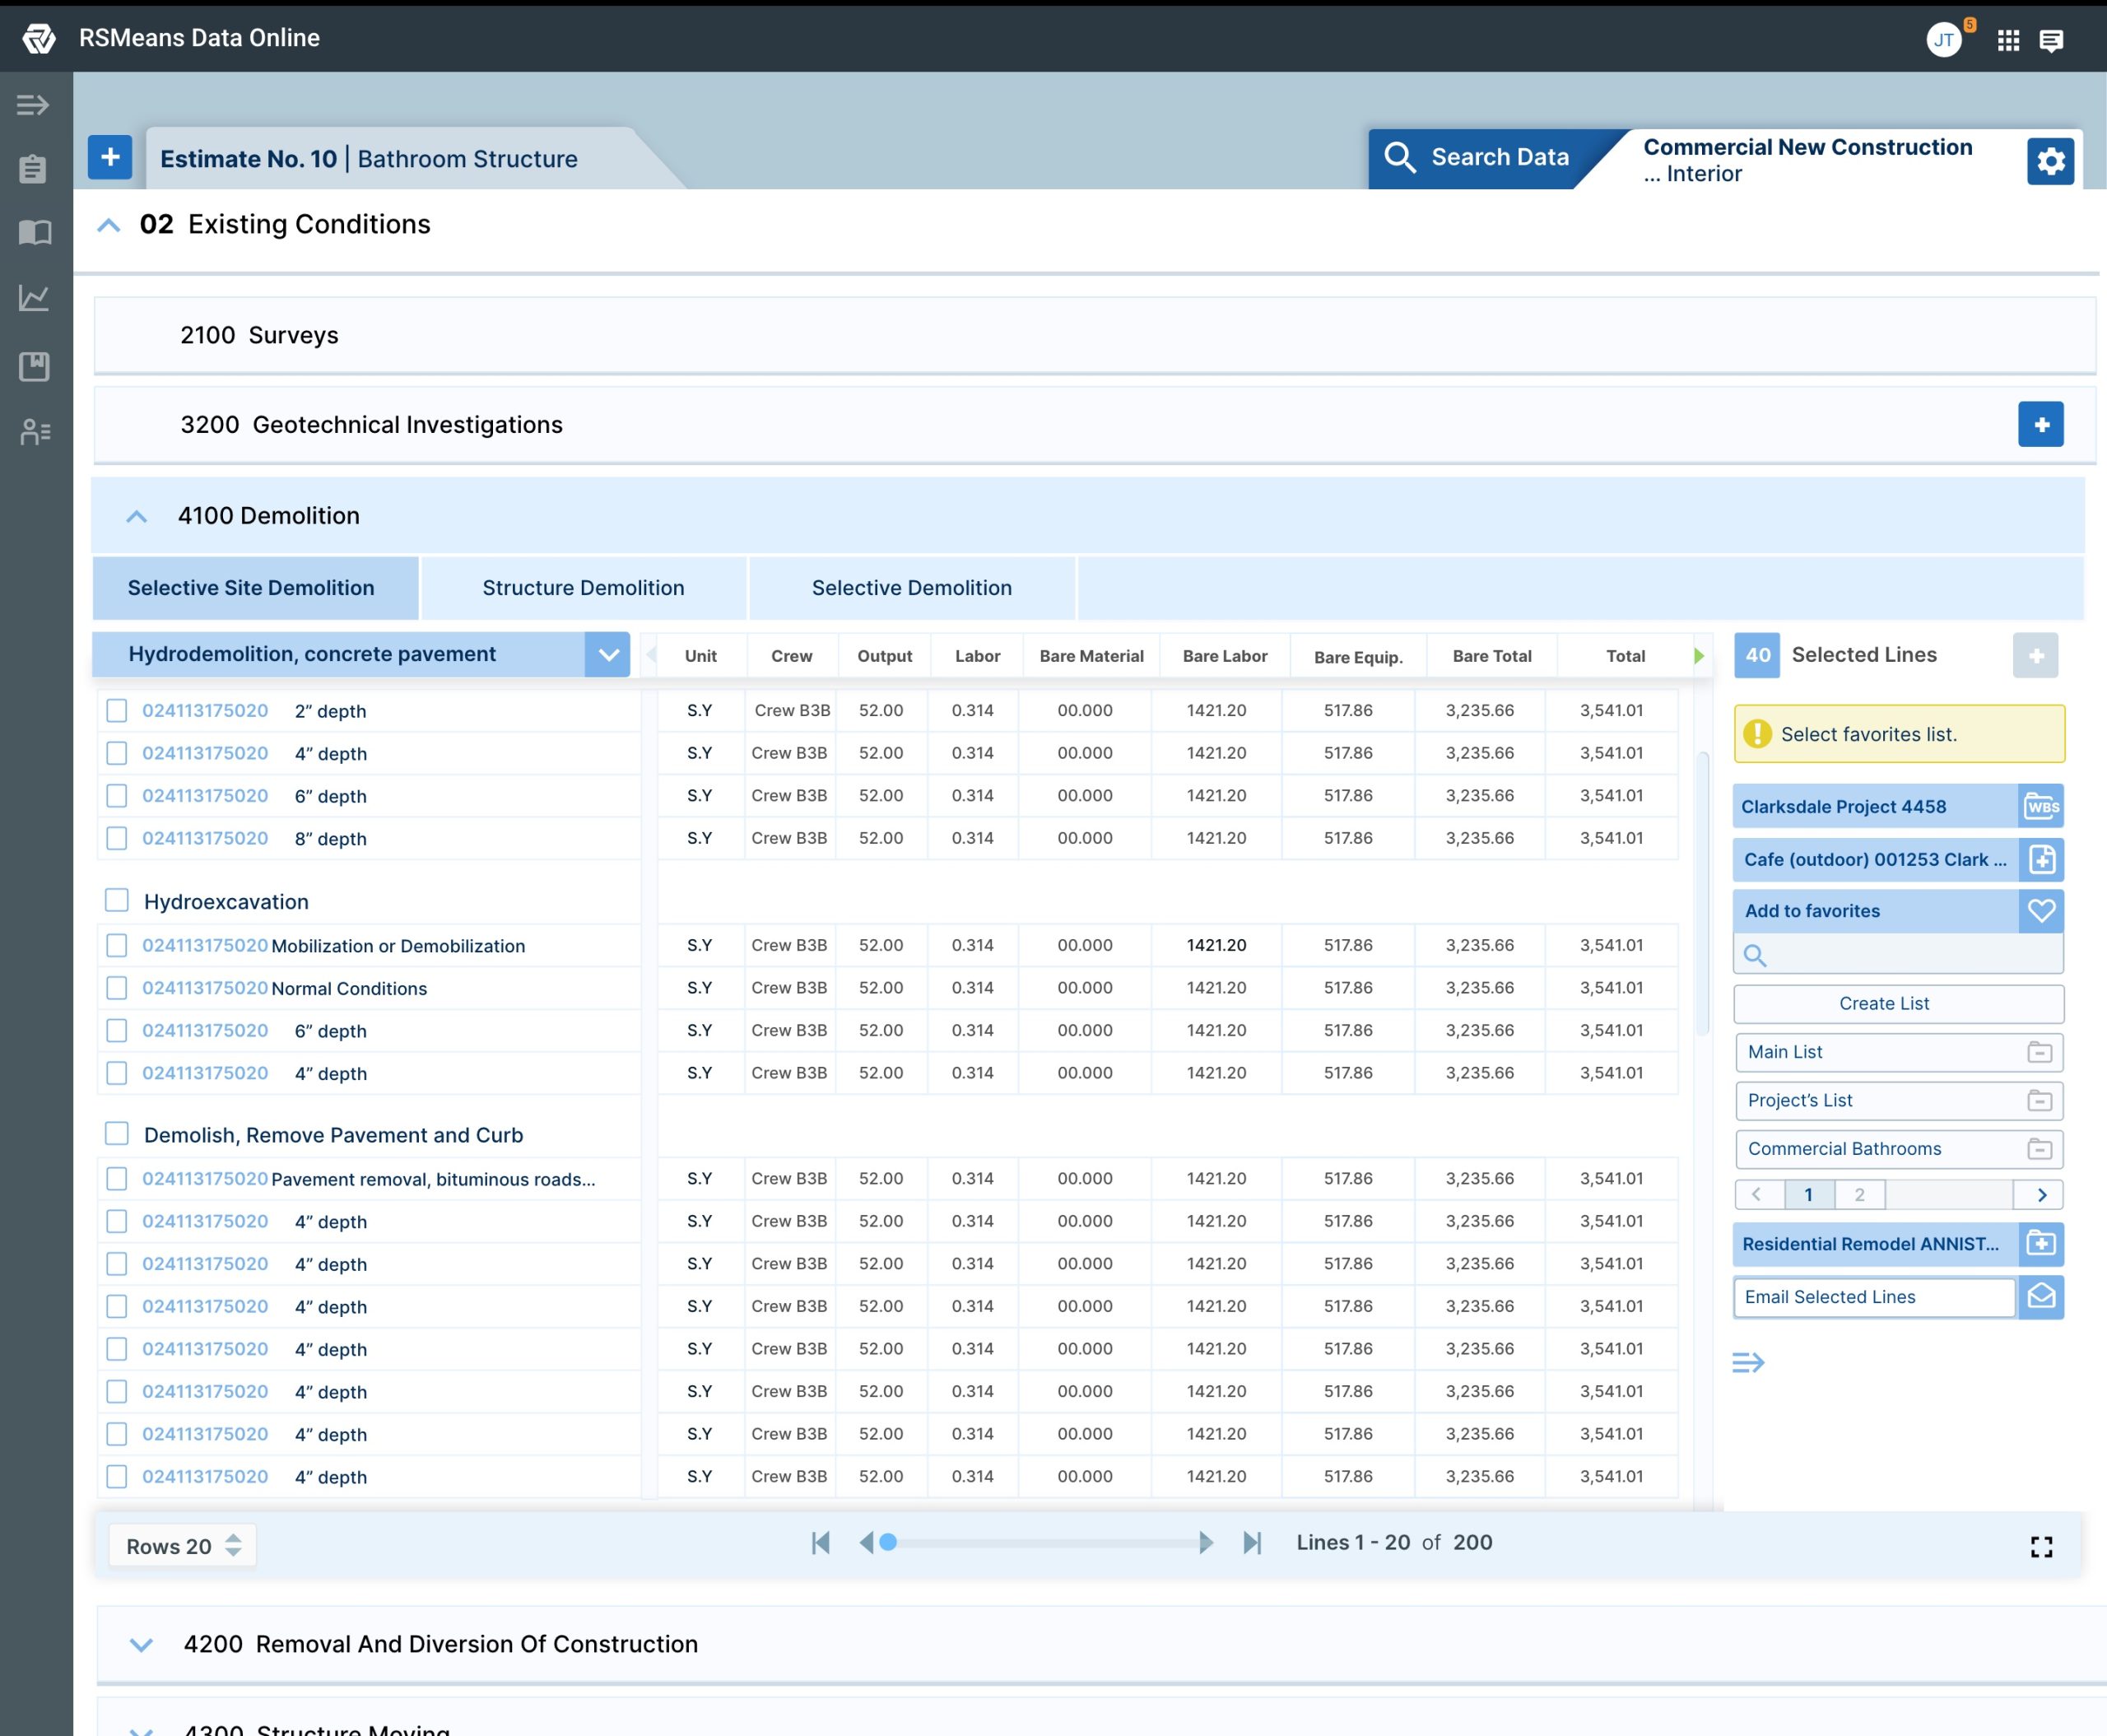
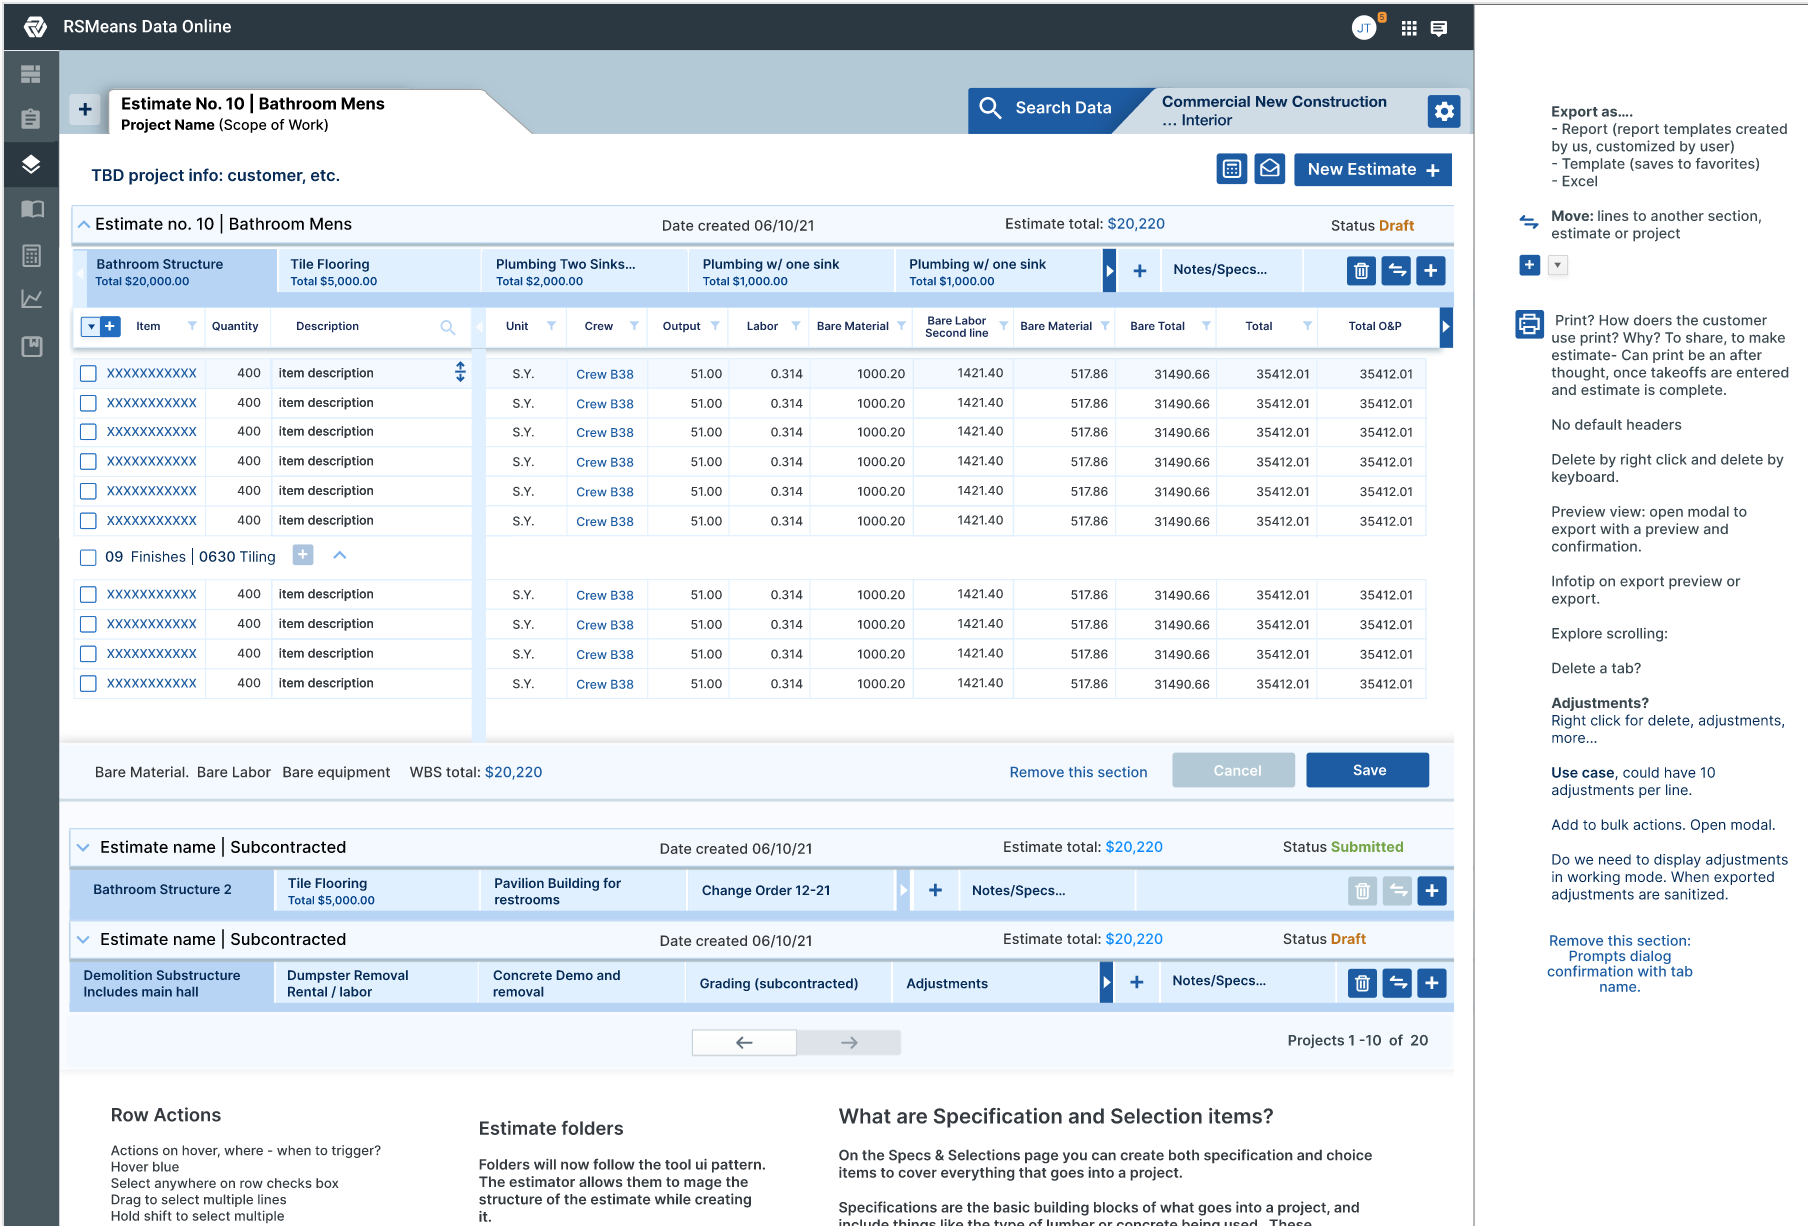
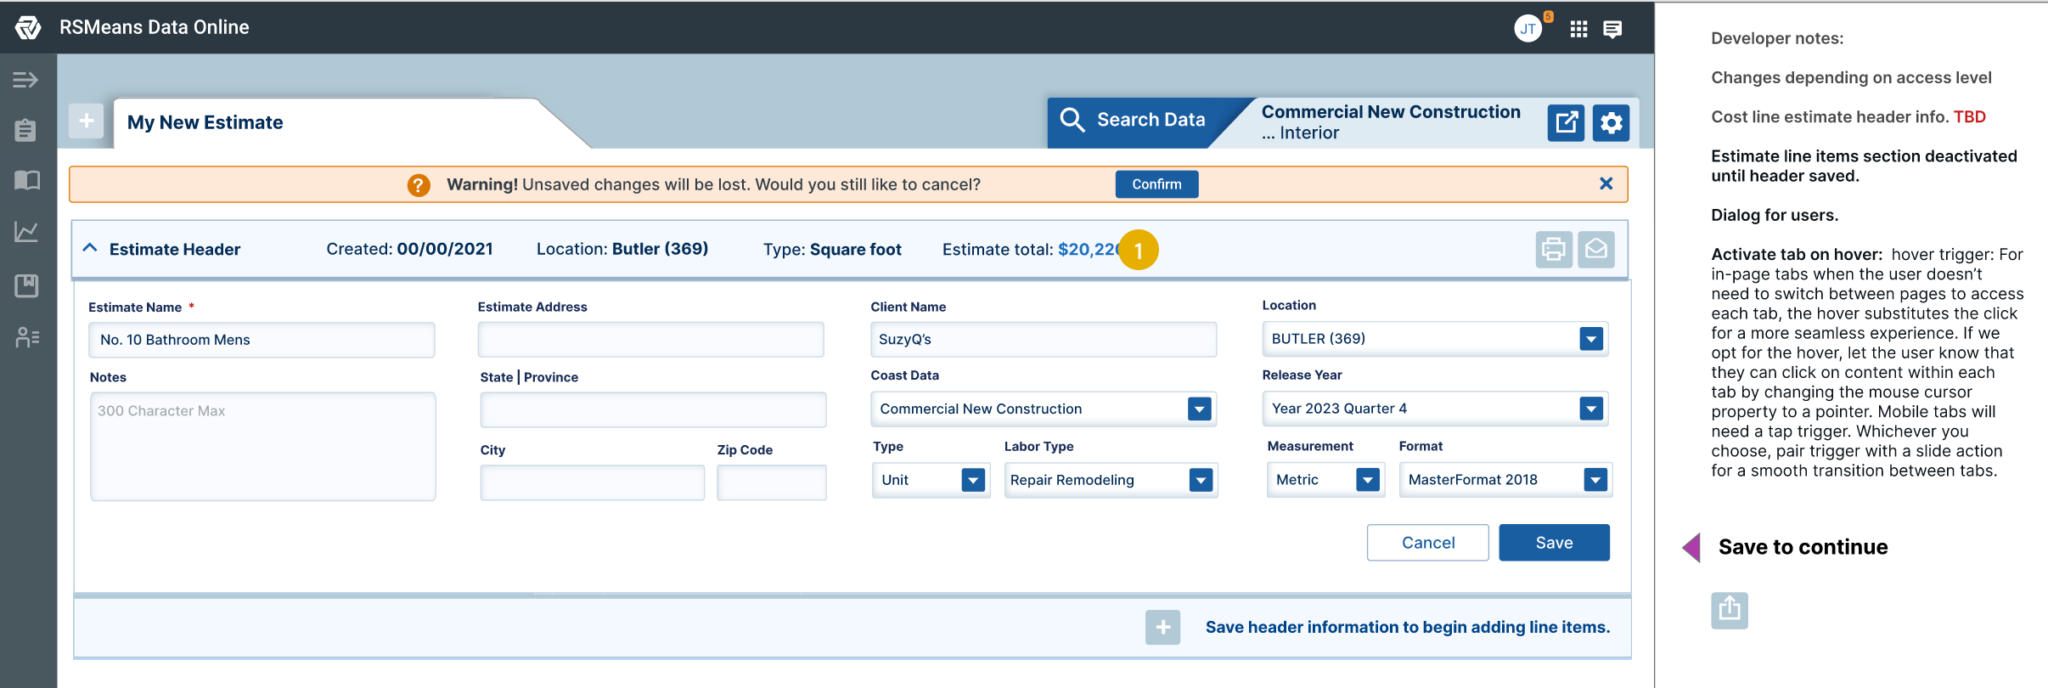
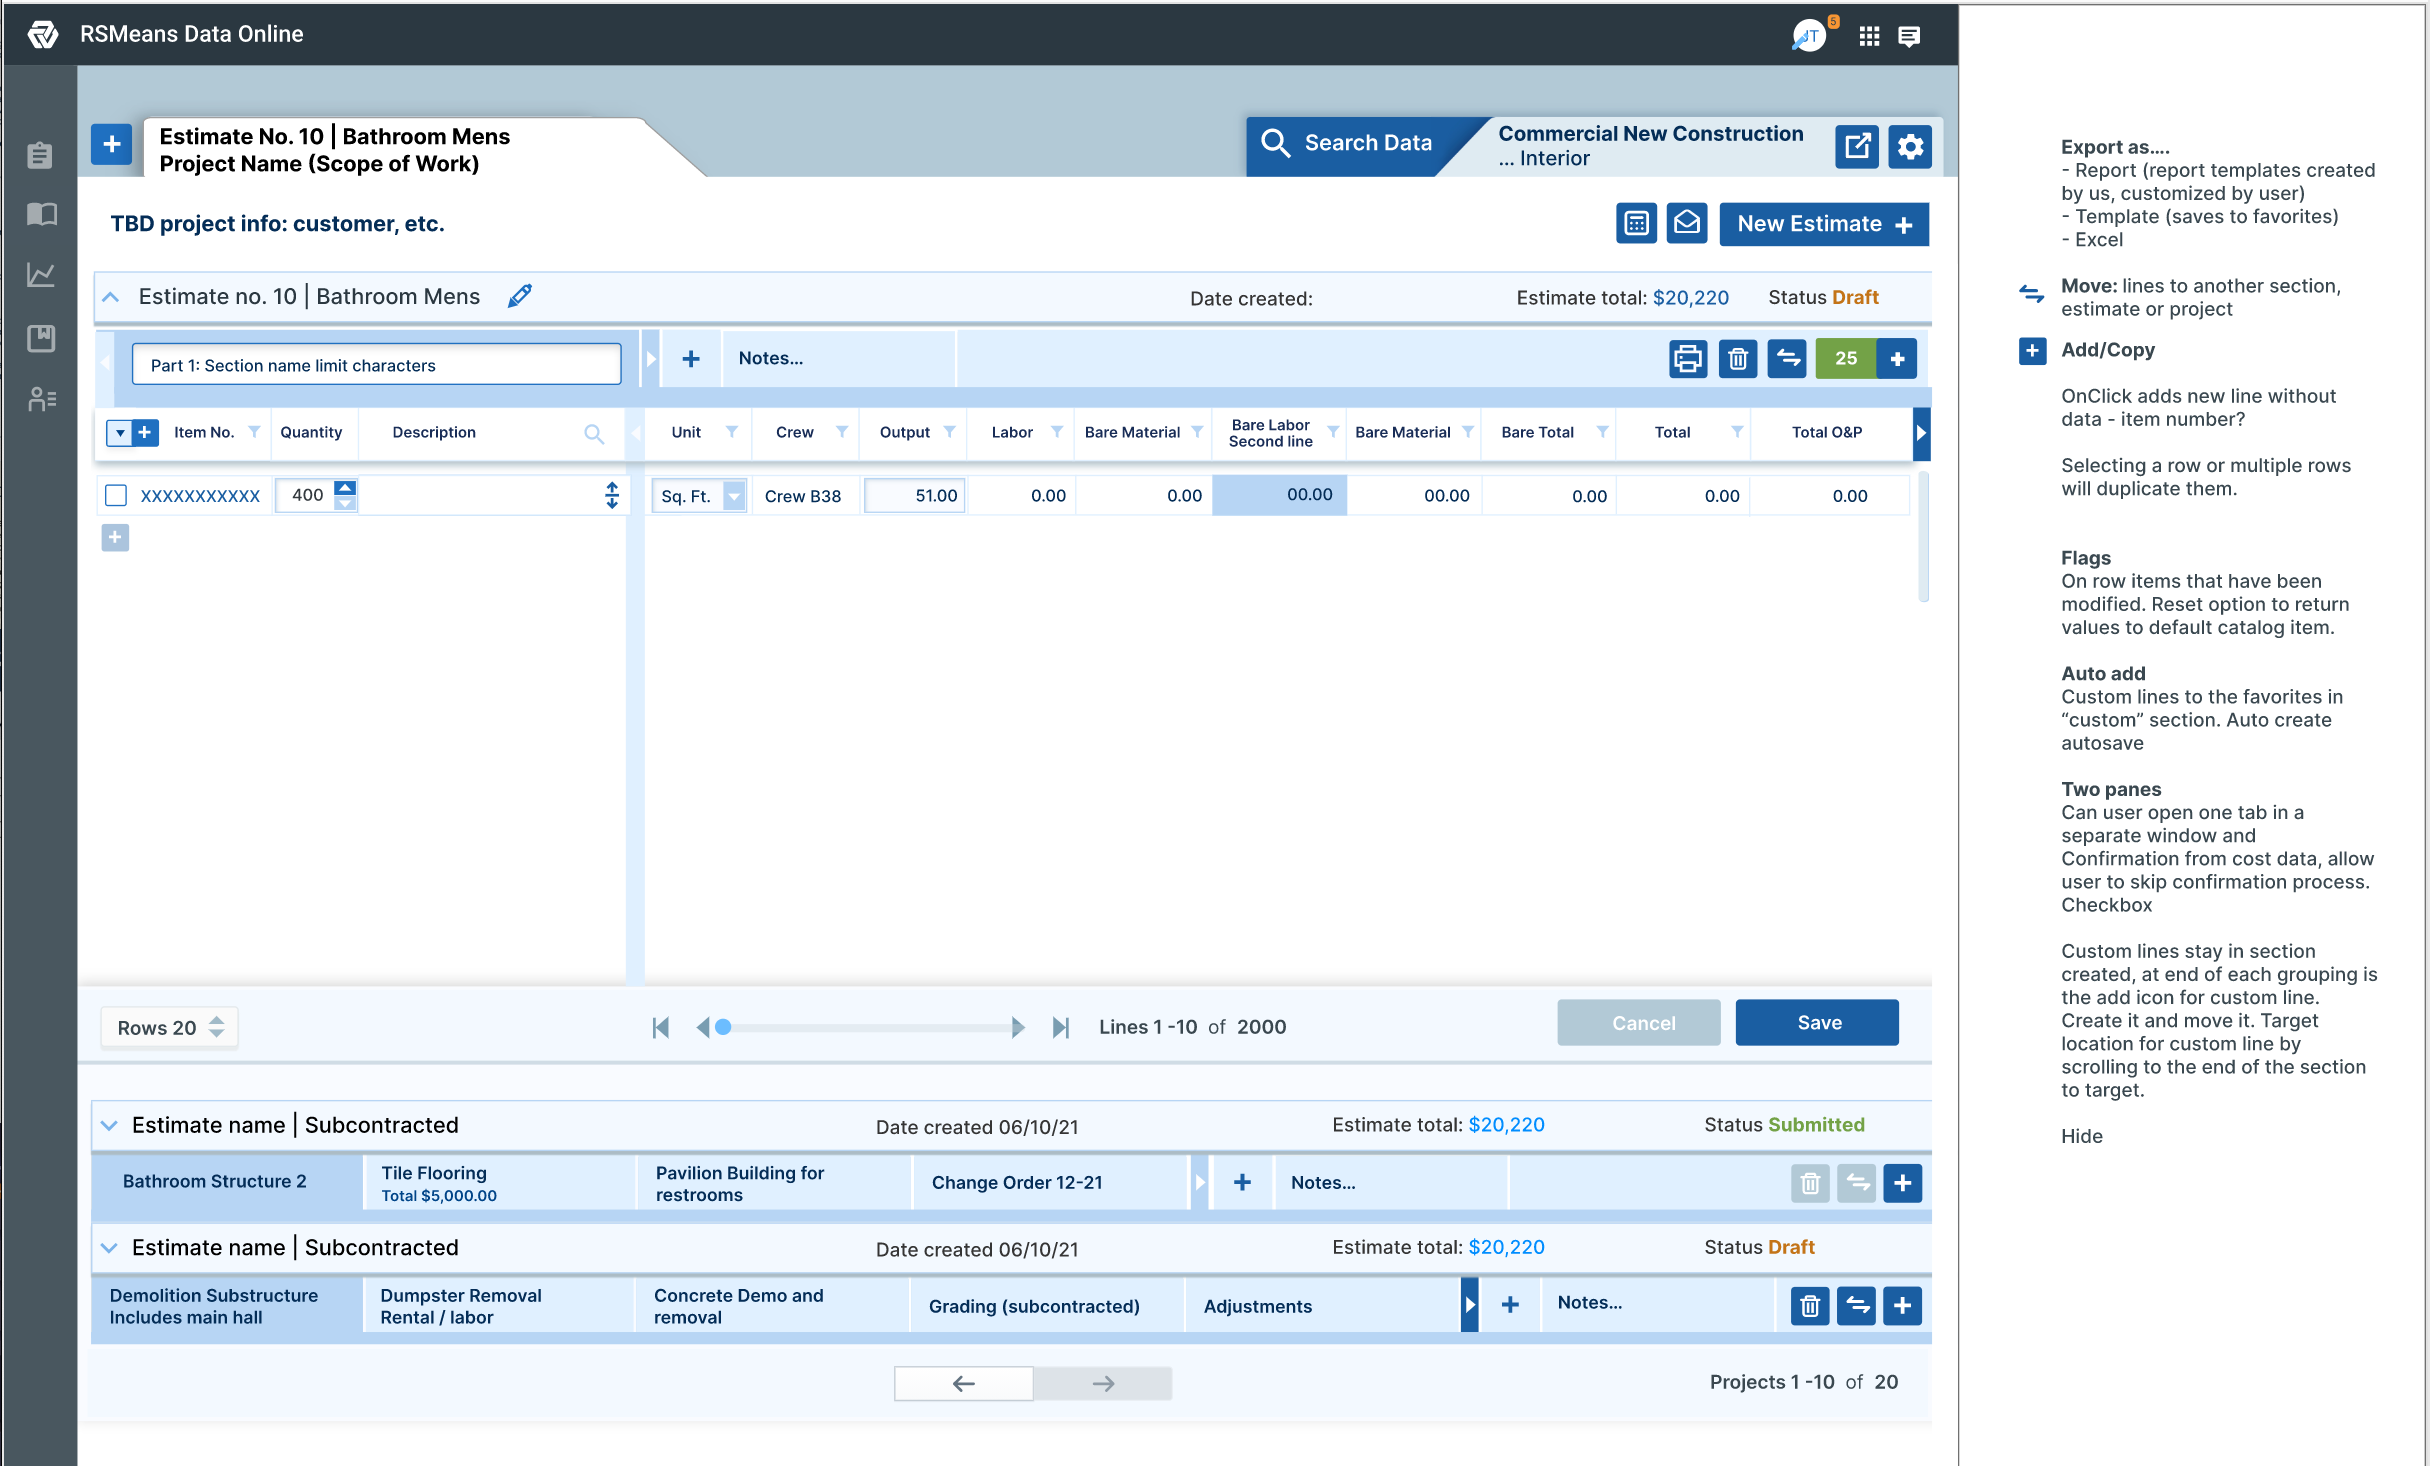
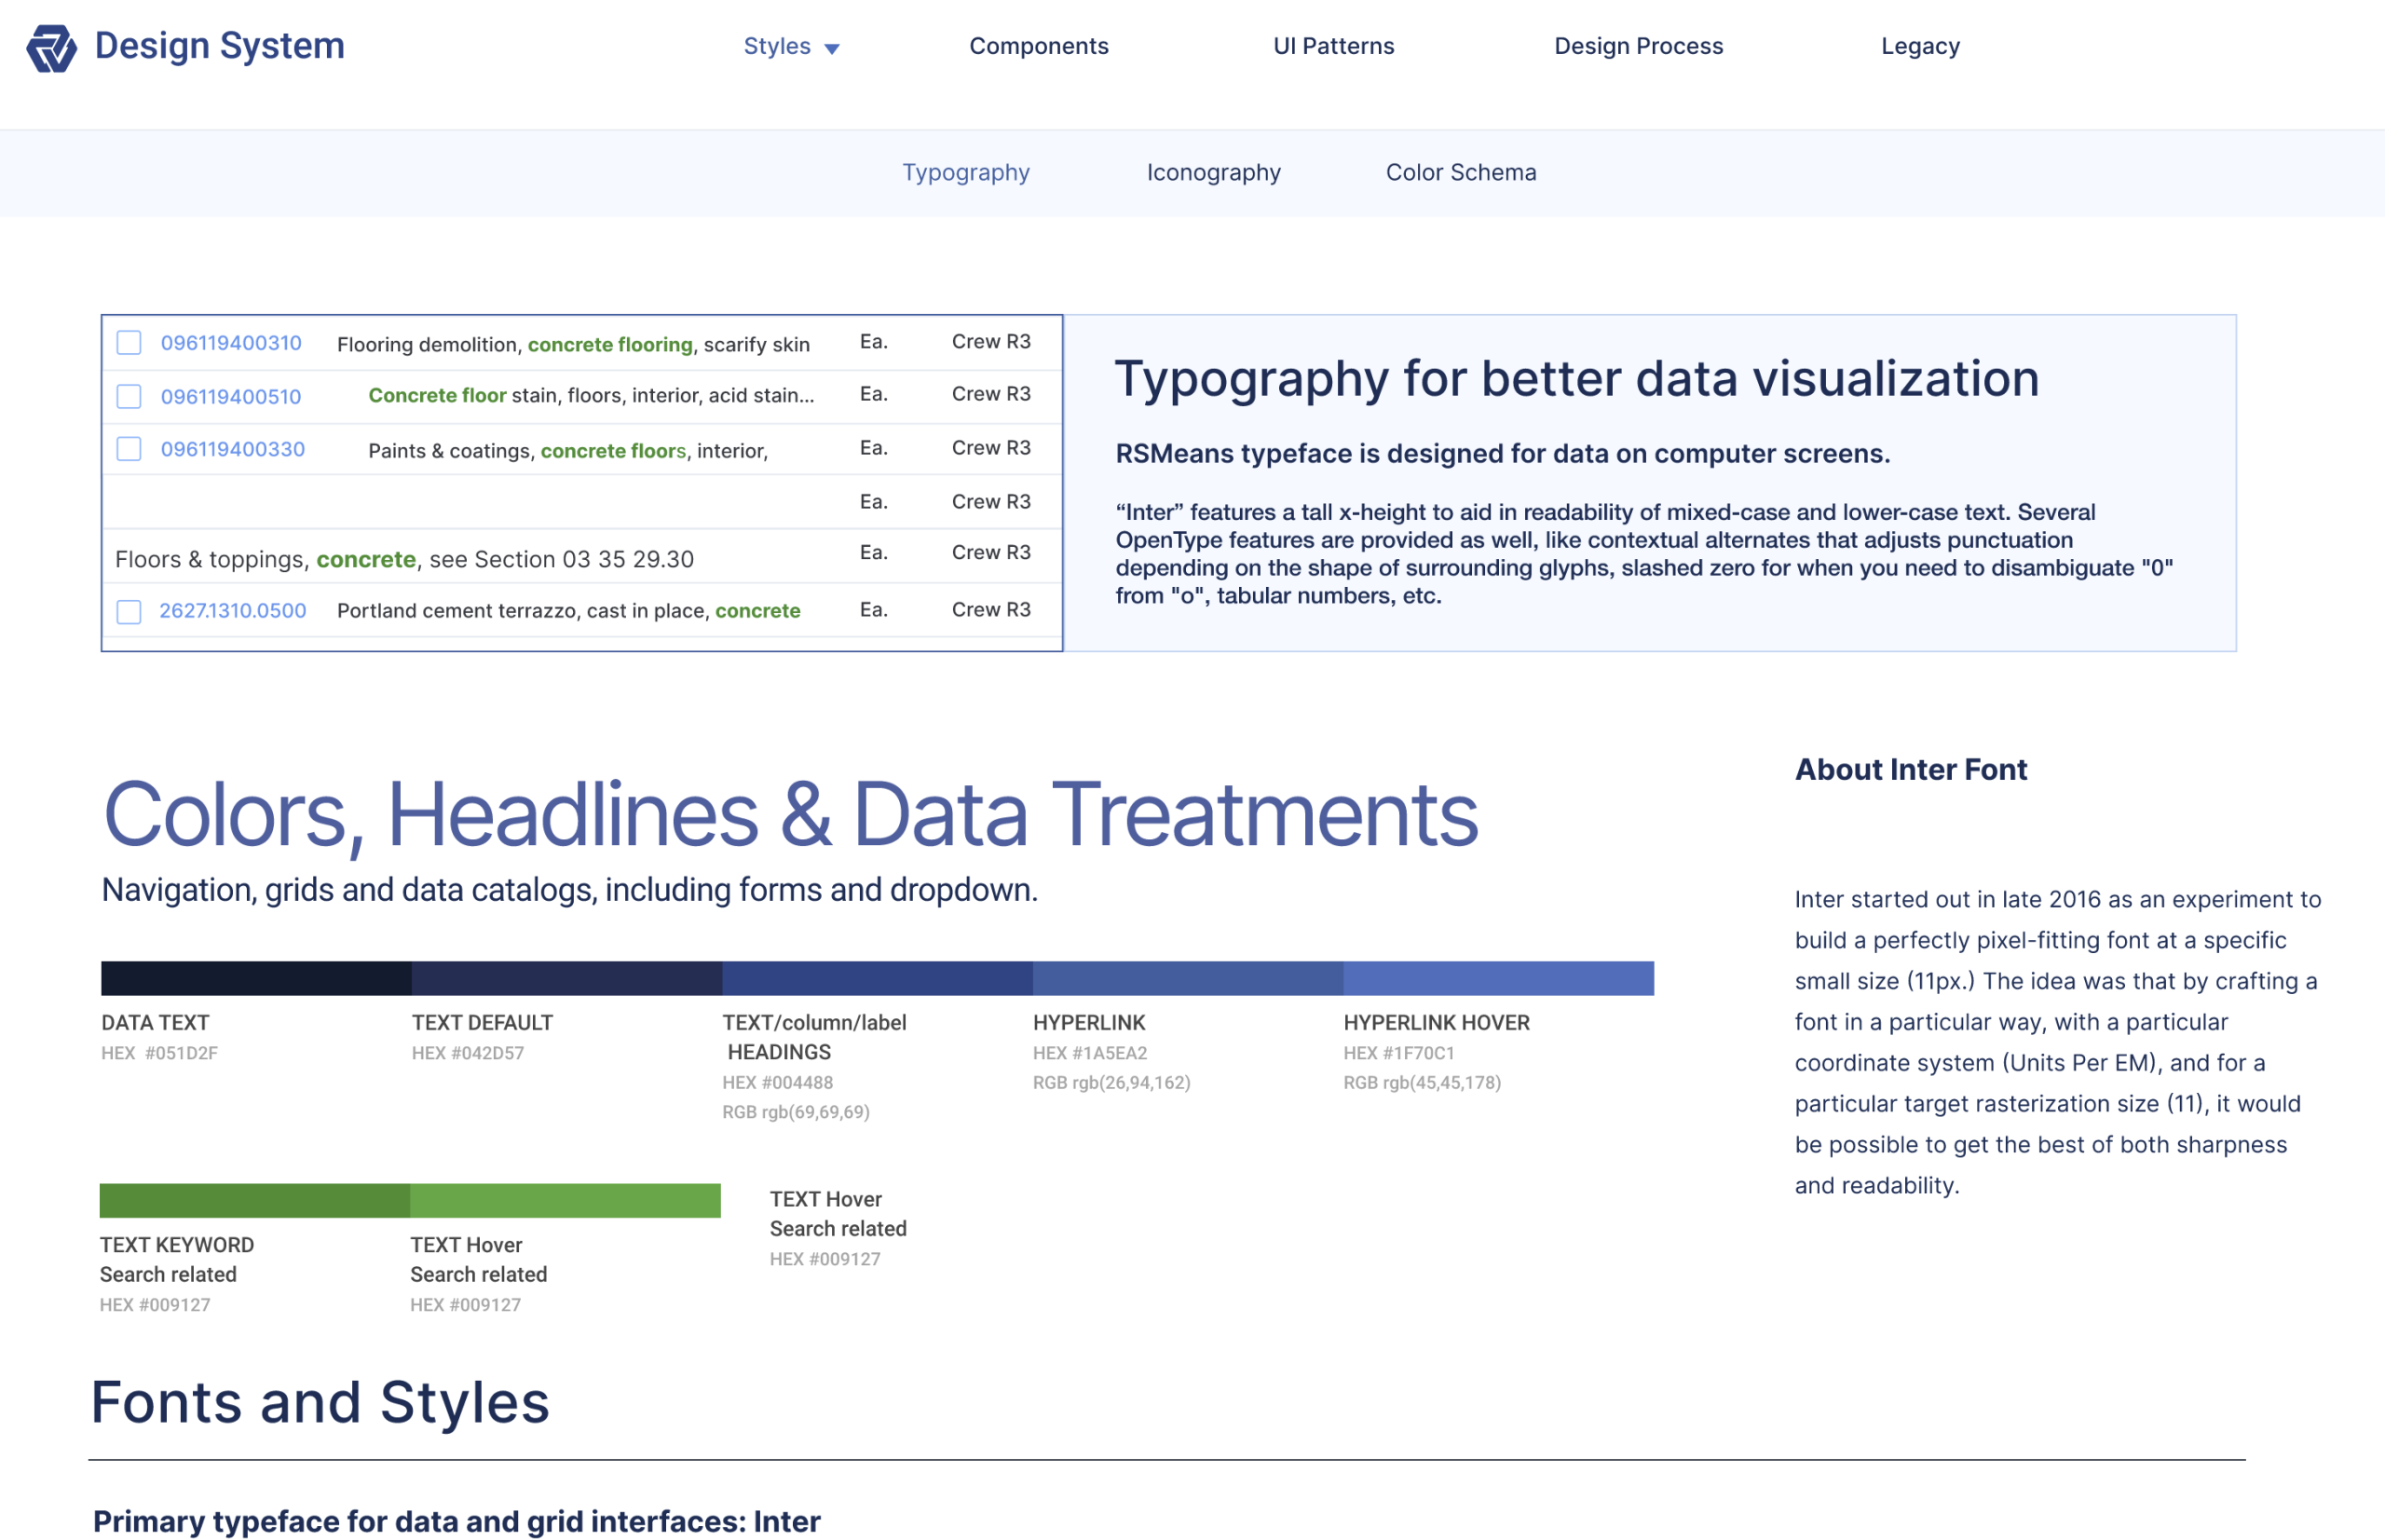
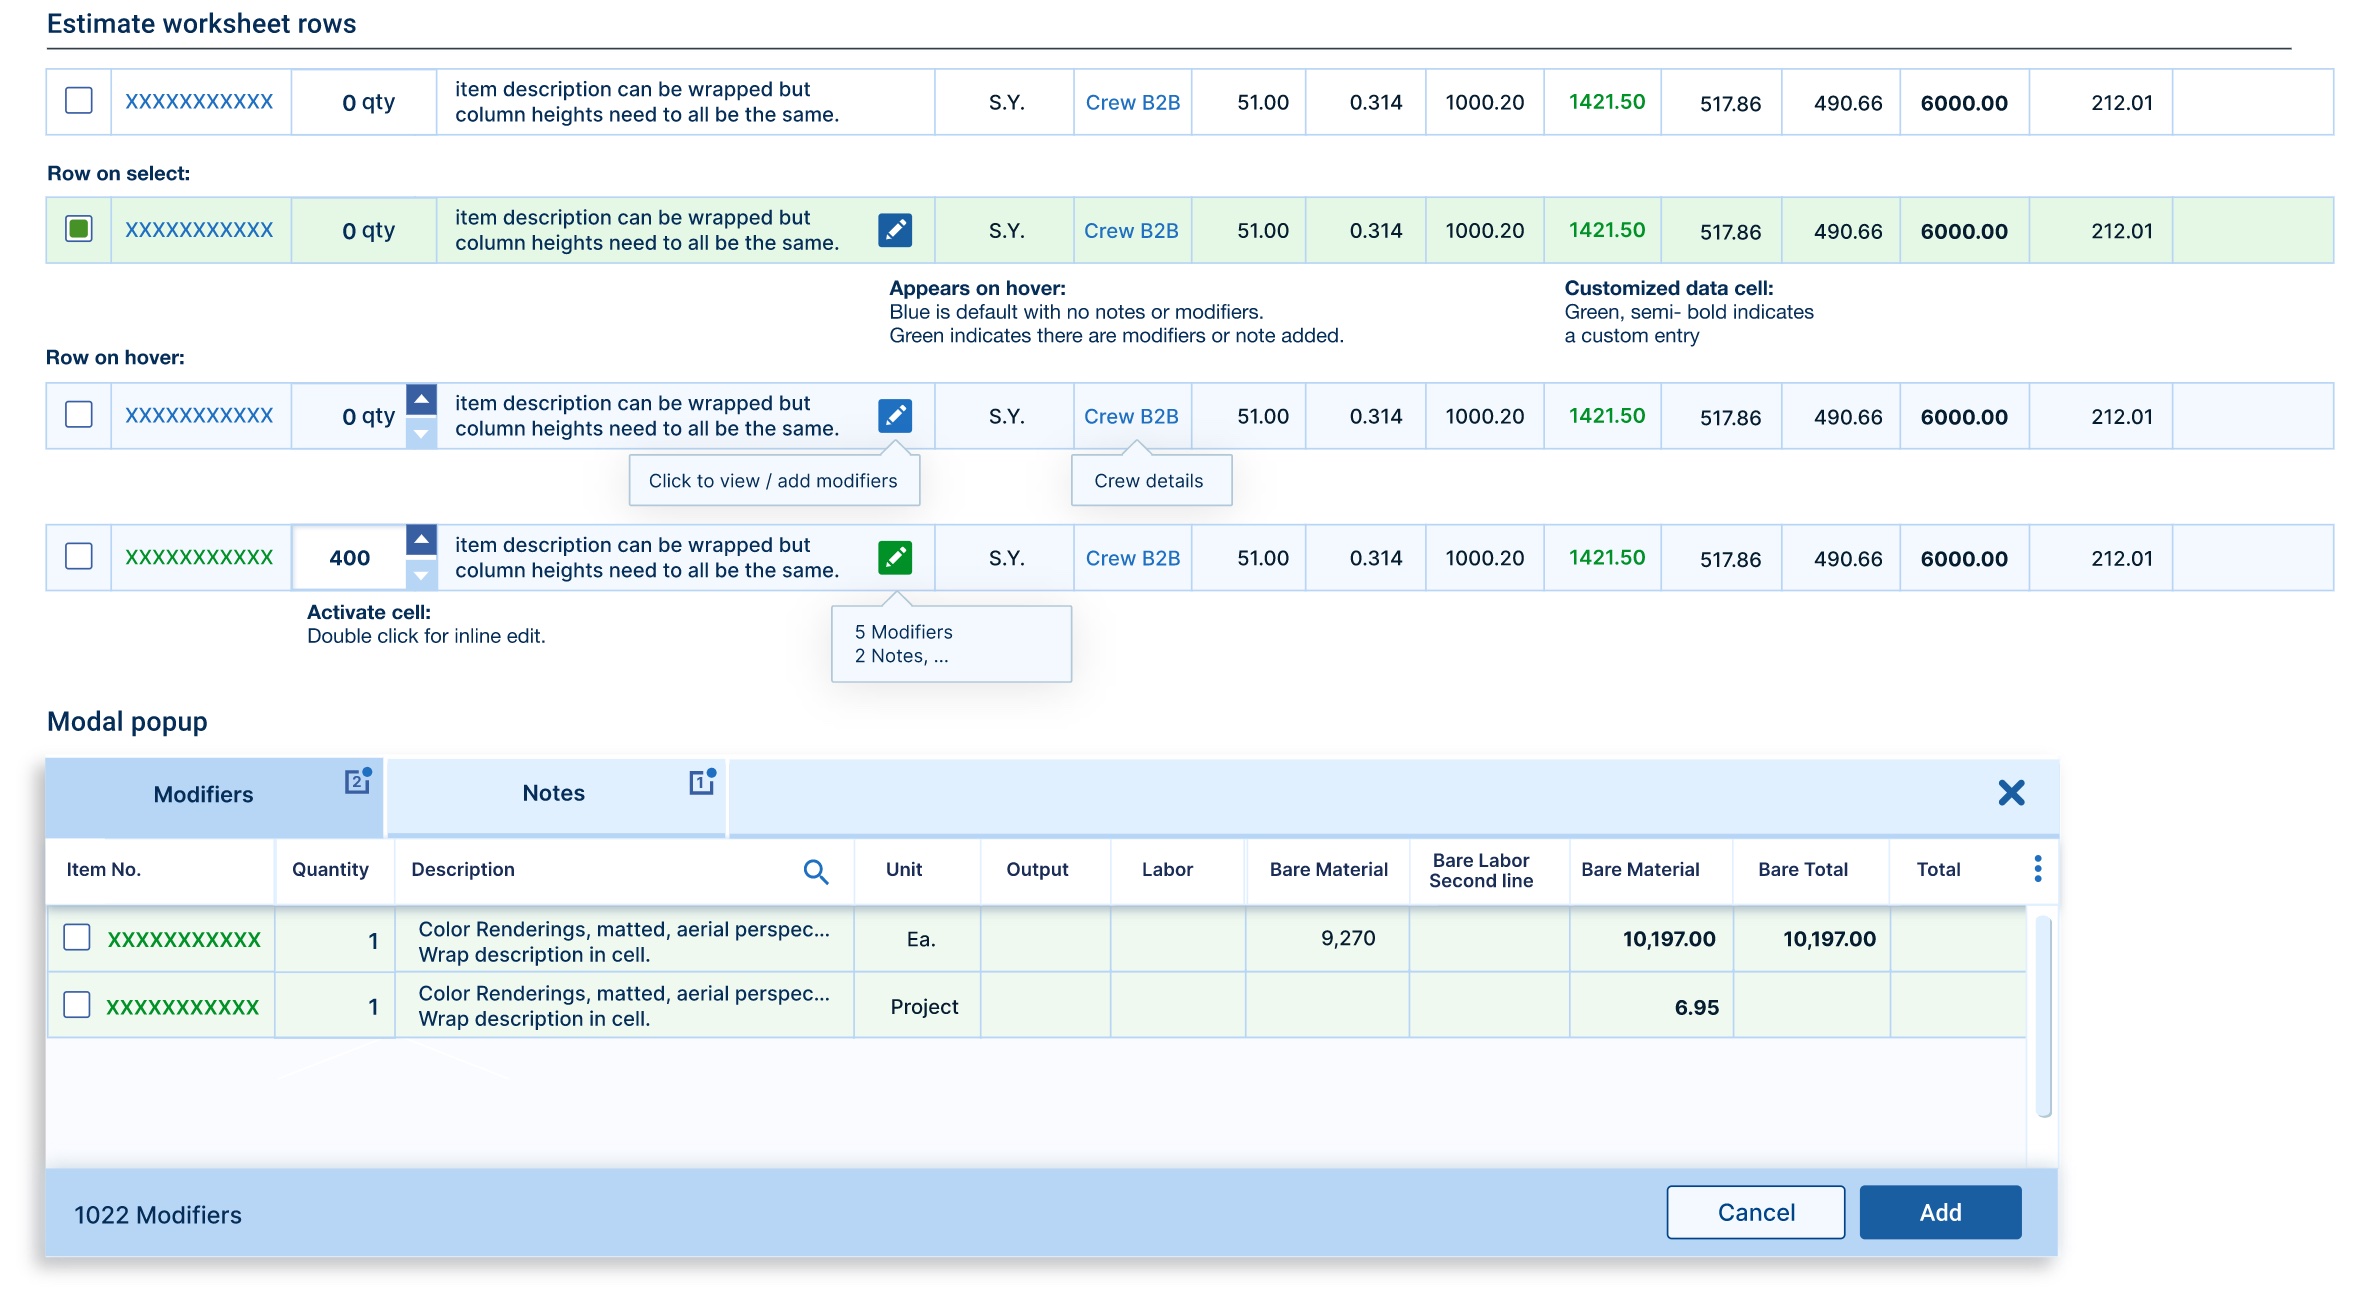
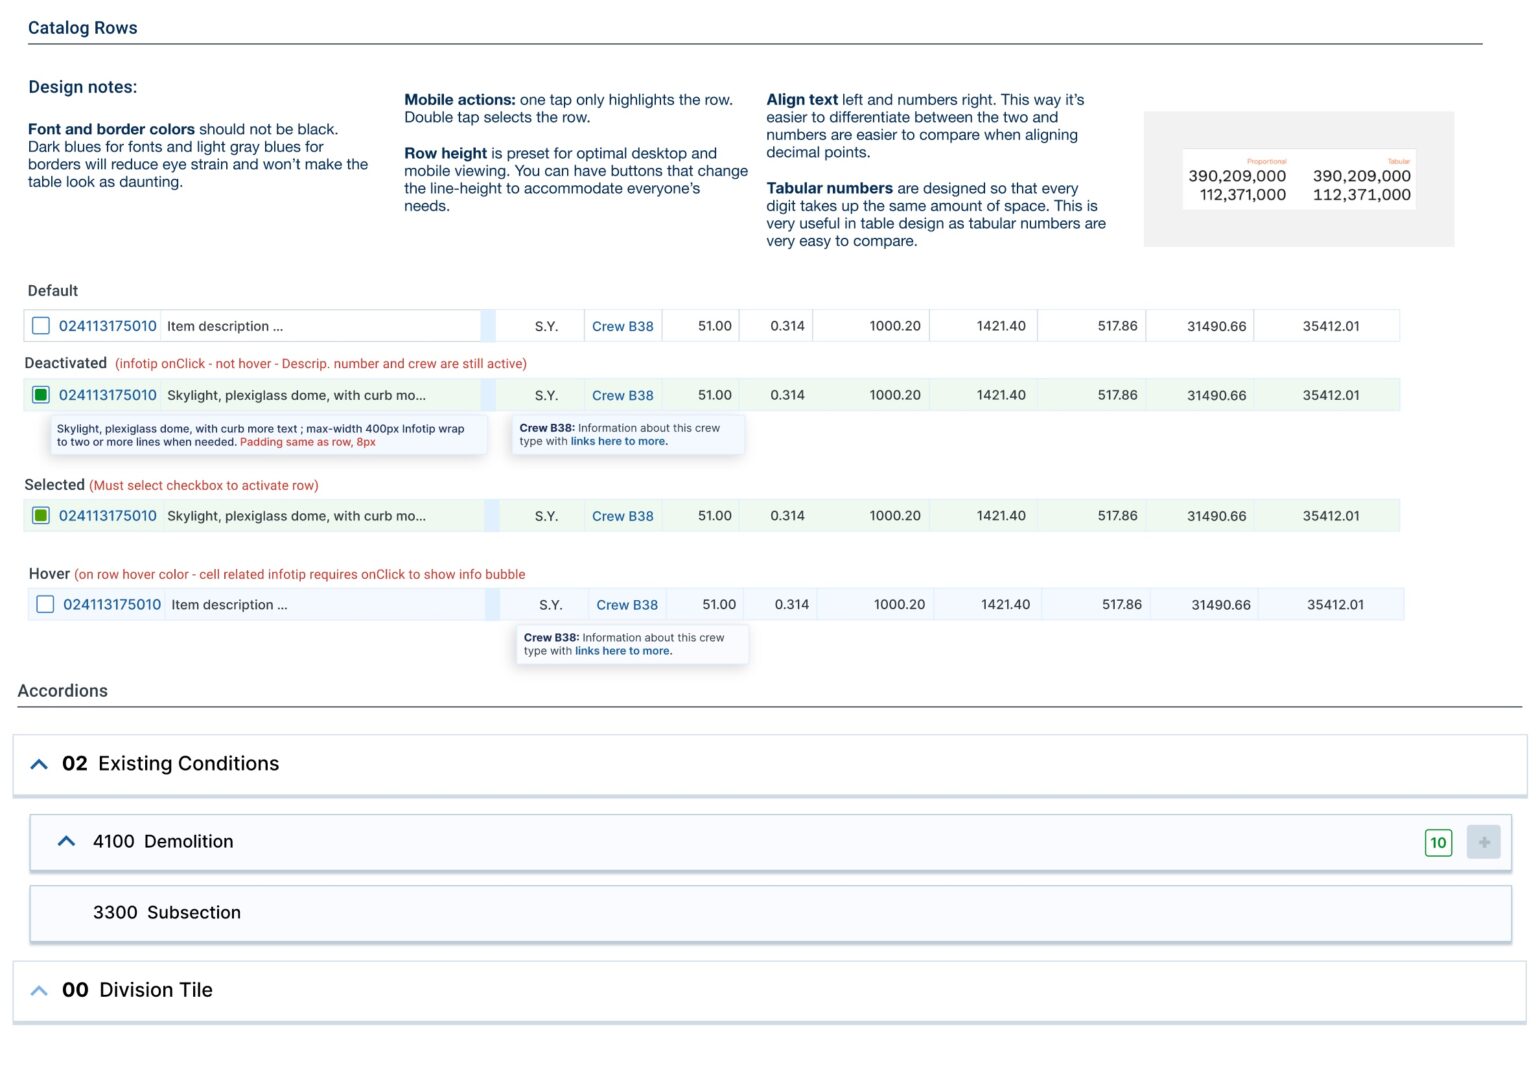
UI Pattern Library for RSMeans Data Online
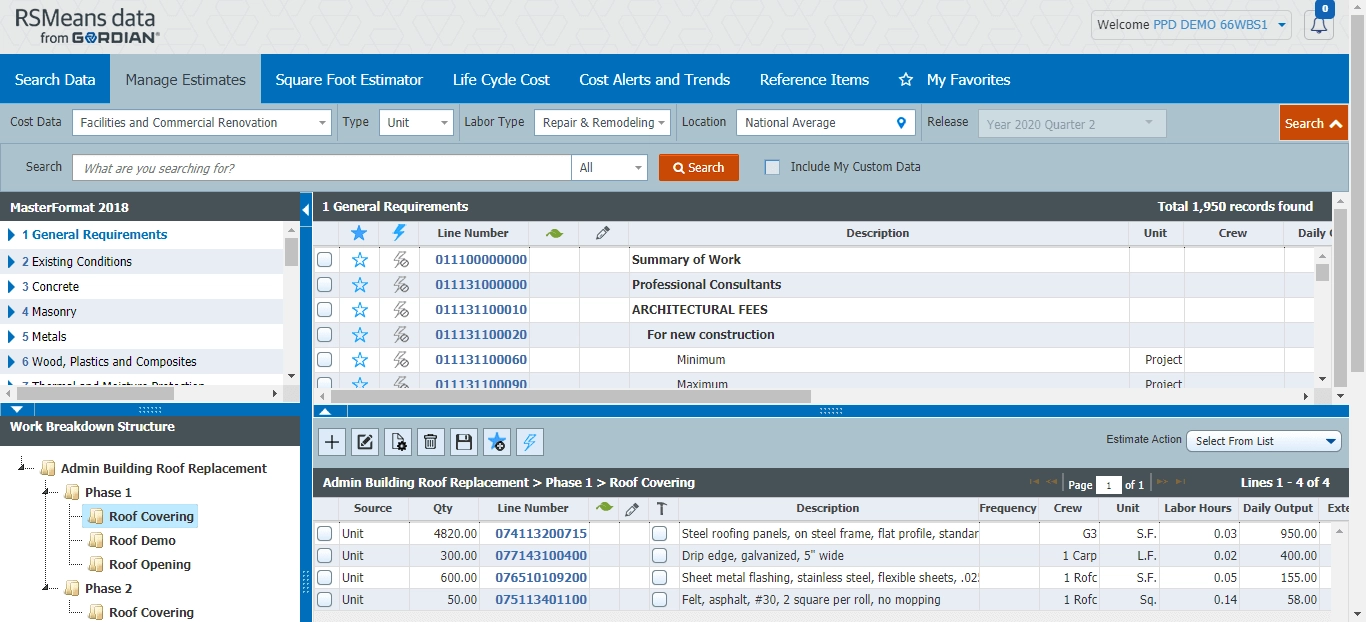
To meet the varied needs of Federal agencies, the Work Breakdown Structure feature within RSMeans Data Online is completely customizable. Agencies can, of course, apply their own standards template like FEMA’s Cost Estimating Format, or break out costs in line with dedicated funding sources like GSA’s Physical Security Program.